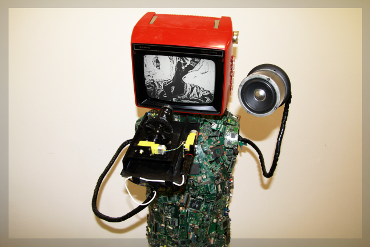
AfterOneDotSixOneEight
This visualization software calculates one position of the Fibonacci sequence, and its surrounding neighbors. The division of two neighbors creates a number, also known as Golden Ratio. The y axis represents this calculated numbers of the Golden Ratio according to the Fibonacci sequence, while its decimals behind the comma are shown along the x-axis.
BACKGROUND
The sequence of Fibonacci numbers result from a repeated iteration of a function, in which the output of one iteration is used as an input for the next iteration. In the scientists challenge to answer the question of how does work nature, the actual number sequence can be wittnessed everywhere, e.g. flower petals, seed heads, fruits, vegetables, pine-cones, trees, shells, spiral galaxies, human anatomy, DNA molecules, and even insect flight patterns.
If a Fibonacci number is divided by its immediate predecessor, the quotient approximates phi, or better known as Golden Ratio. A good example of using values from the Fibonacci sequence in geometry is the Golden Spiral.
The history of the Fibonacci sequence and the resulting Golden Ratio goes back to ancient Sanskrit poetry, in which the first numbers of a Fibonacci sequence has been used to create the very rhythmical structure of poems, the meter. Later on, in ancient Greece ca. 300 B.C., Euclid of Alexandria took on this number sequence to implement it into his geometrical approach, calling it “extreme and mean ratio”.
The term De divina proportione, or “Divine proportion” is mentioned first time by Mathematician Luca Pacioli in his work with same name published in 1509. Adding the word “Golden” in 1835 by Mathematician Marin Ohm completed the journey of name creation to the todays known Golden Ratio.
However, the Fibonacci sequence has its name from the Italian Mathematician Leonardo Bonacci, also know as Fibonacci. In his work “Liber Aabci” (Book of Calculation) published 1202, he introduced the sequence to Europe, when he used it as an example to explain the growth of rabbit population based on idealized assumptions. But the Fibonacci number and its related Golden Ratio has not only be used by humans to create an answer to a rabbit problem.
SOFTWARE
To realize the approach of visualizing the Fibonacci sequence in its fast growing size on one hand, while calculating the continuous shrinking fractional part described by decimals of the Golden Ration on the other hand, an OpenGL application written in C++ using openFrameworks is one suitable way of accomplishing the task. On the very heart of the program, the Fibonacci sequence is created by a for loop, which adds each new calculated Fibonacci number to the end of a list, also known as dynamic array or vector. This “list” will go through another loop, that takes the predecessor, divides it to get the Golden Ration, especially the decimals of its fractional part. The result gets added to yet another “list” (array), thus building the basis of the visualization.
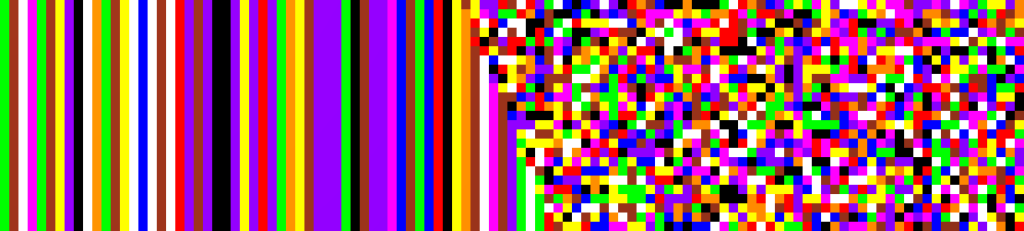
Each calculated Golden Ratio ends up with a different fractional part, depending on which position of the Fibonacci sequence is used to calculate it. The decimals are then used to dedicate the color and height of cubes used for each decimal in the final visuals.
Decimal to Colors:
0→White : 1→Red : 2→Sienna : 3→Orange : 4→Yellow : 5→Green : 6→Blue : 7→Lilac : 8→Pink : 9→ Black
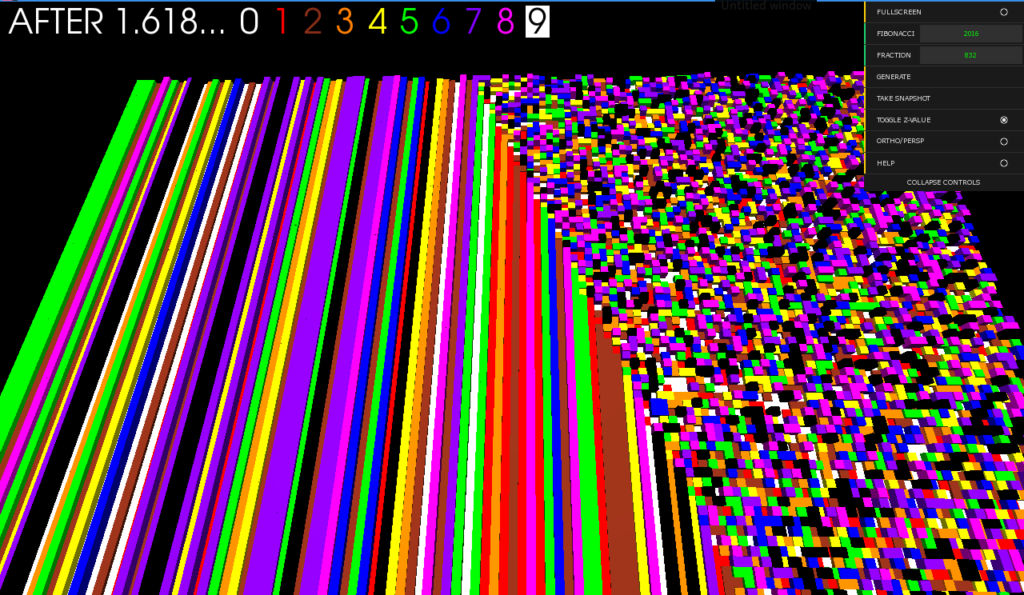
Graphical User Interface
Control panel:
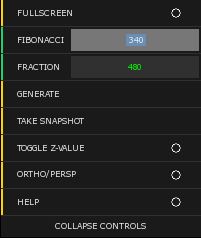
FULLSCREEN: Toggles window size to full screen mode
FIBONACCI: Enter a position of the Fibonacci sequence
FRACTION: Enter a position of a decimal in the fractional part of the Golden Ratio
GENERATE: Press button to start calculating the matrix and to generate the visuals
SNAPSHOT: Press button to save an image of the result
TOGGLE Z-VALUE: Add third dimension to the visuals
ORTHO/PERSP: Switches between orthographic and perspective view
HELP: Displays help section
COLLAPSE CONTROLS: Hides/Unhides control panel
- Add numbers and generate visuals
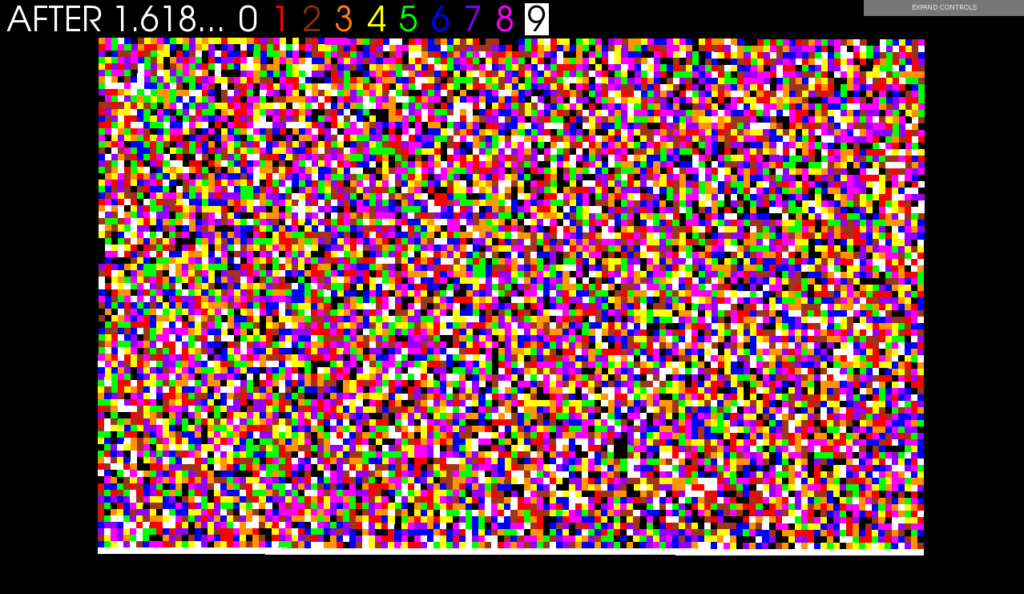
An example of a generated Fibonacci position is:
Fibonacci[2056] is
13186080159590828137312870636756449285324437832919031635322613937891720963184134715369565392153900272
32937421691913960413391950770992008831684448885597619185664240784863287701895261102339916959964553619
18725753137304497423160628546275798170632474563951636696022676493945918964286633881363371985949652263
3957822461496652416467291028426855974063267554503559819309885147303740836925226711064953420823167859
77514777204856071395313570
- Toggle Z-value
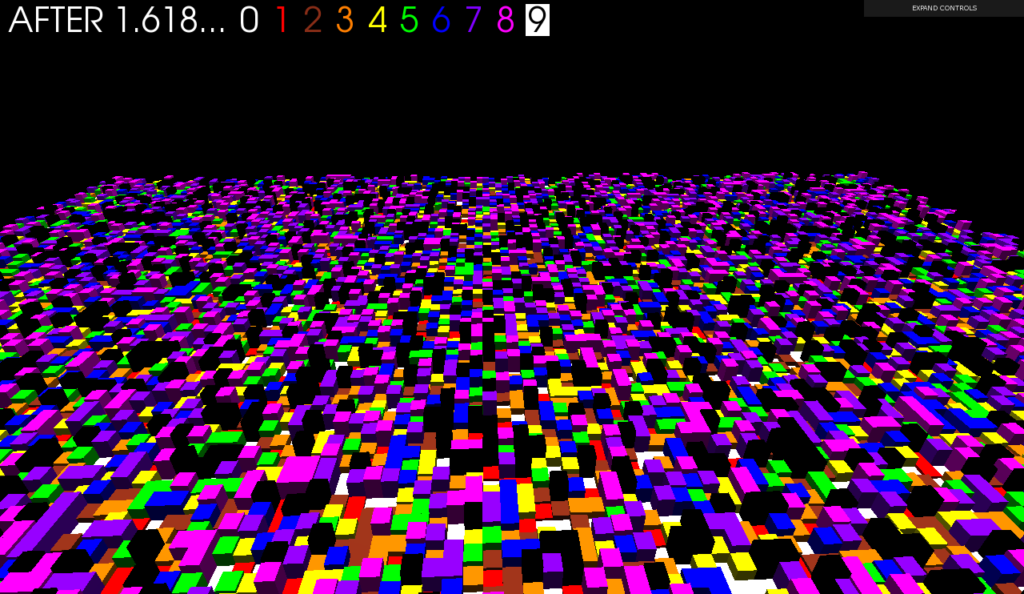
- Find the accuracy line of the Golden Ratio: The higher the number in the Fibonacci sequence, the more accurate the result of the Golden Ratio in its fractional part.
_______
EXHIBIT 2016
For the exhibition "METASIS" in 2016, the 2016th position of the Fibonacci sequence ->
13186080159590828137312870636756449285324437832919031635322613937891720963184134715369565392153900272
32937421691913960413391950770992008831684448885597619185664240784863287701895261102339916959964553619
18725753137304497423160628546275798170632474563951636696022676493945918964286633881363371985949652263
3957822461496652416467291028426855974063267554503559819309885147303740836925226711064953420823167859
77514777204856071395313570
The number as implementation for the Golden Ration represented as middle row, generated following visuals
This has been used as draft to produce a representation made with wood and acrylic paint.
"AfterOneDotSixOneEight" 240 x 60 cm
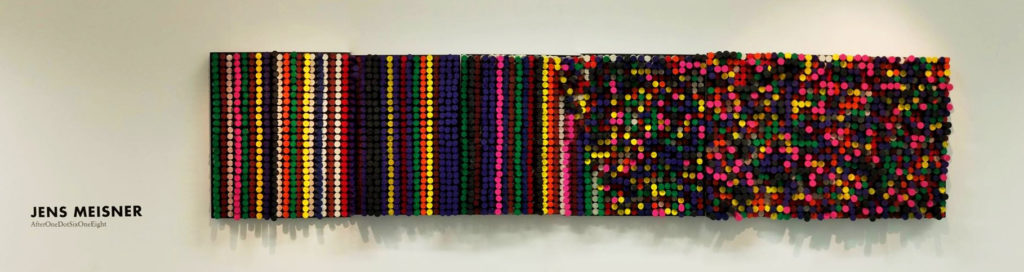
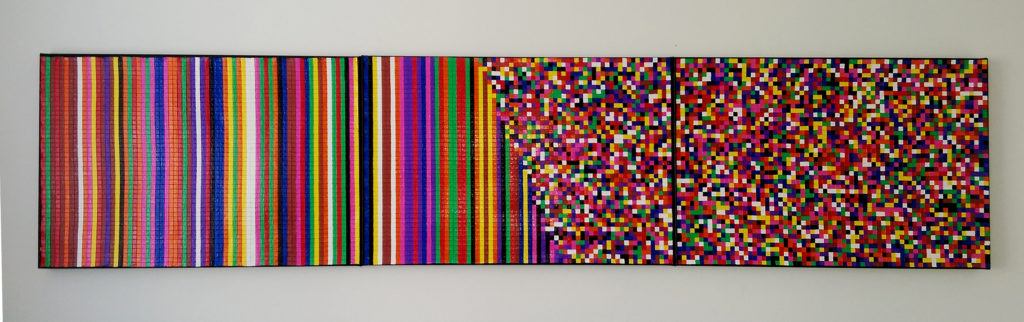
EXHIBIT 2017
In this version I decided to use the 129064th position of the Fibonacci sequence, which has 26973 digits ->

Software-generated draft, that uses fibonacci number above to calculate Golden Ratio,
which is represented as middle row of this piece. The line between repitition and noise
goes along the 53888th digit behind 1.618:
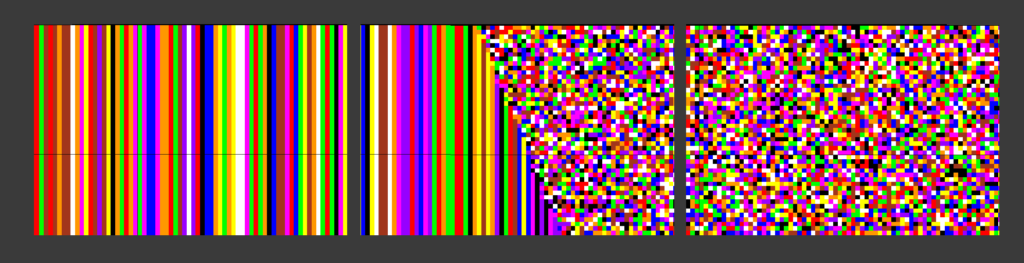
The final piece is made of canvas, metal fence mesh and acrylic paint. It is made of 3 canvas
in size 90x60 cm.
SOURCE CODE: